


Swiftwater’s legal operations job market report counts and describes the legal operations roles employers post publicly. The October 2026 edition covers 914 postings from 648 employers: disciplines, seniority, remote share, posted salary ranges by level, and where the roles are. It is a research project for education and information purposes, developed in conjunction with Swiftwater AI Labs, and it will be updated each quarter.
The postings are curated weekly from employer career sites and legal operations job sources. They are a view of what employers ask for, and they are not a statistical sample. Posted pay ranges lean toward places with pay transparency laws, and some postings are stale, duplicated, or placed by staffing agencies. Every figure below gives the count it comes from, and the method section at the end sets out how the data was handled.
How many legal operations jobs are open?
The October 12, 2026 edition of Swiftwater’s legal operations job data set holds 914 postings from 648 employers, after one duplicate was removed from 915 rows. Most are recent: 711 were posted or confirmed in the 30 days before the edition date, 159 in the 31 to 90 days before it, and 44 are older than 90 days. This is the first edition, so the counts describe this data set only and show no trend yet.
Three things shape the count. Postings that list several locations count once, and 205 of them do. Thirty-four are outside the United States. And 50 postings, 5.5% of the data set, come from staffing and recruiting firms, which we identify by company name. Where agency postings could change a figure, the report shows it with and without them.
Which disciplines are hiring?
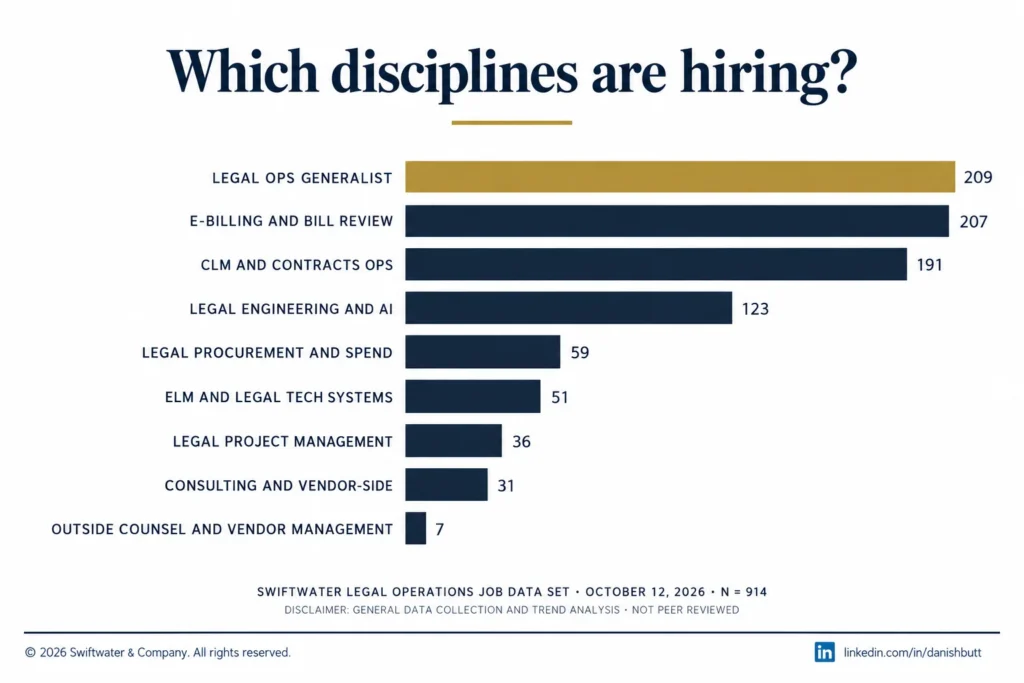
Generalist legal operations, e-billing and bill review, and CLM and contracts operations lead the market, with about a fifth of postings each. Legal engineering and AI transformation is the fourth-largest group at 123 postings. Together the top four disciplines account for 730 of the 914 postings, or 80%. Procurement, legal technology systems, project management, and vendor-side roles make up the rest.
| Discipline | Postings | Share of 914 |
|---|---|---|
| Legal operations generalist | 209 | 22.9% |
| E-billing and bill review | 207 | 22.6% |
| CLM and contracts operations | 191 | 20.9% |
| Legal engineering and AI transformation | 123 | 13.5% |
| Legal procurement and spend | 59 | 6.5% |
| ELM and legal technology systems | 51 | 5.6% |
| Legal project management | 36 | 3.9% |
| Consulting and vendor-side | 31 | 3.4% |
| Outside counsel and vendor management | 7 | 0.8% |
Without agency postings the order of the top three changes slightly: generalist 202, CLM and contracts 189, and e-billing and bill review 183, out of 864. Agencies post e-billing and billing roles more than any other discipline. CLOC’s 2026 State of the Industry Report found technology strategy (80%), financial management (72%), and outside counsel and vendor management (62%) the leading legal operations focus areas, which matches where the postings sit.
What seniority levels are posted?
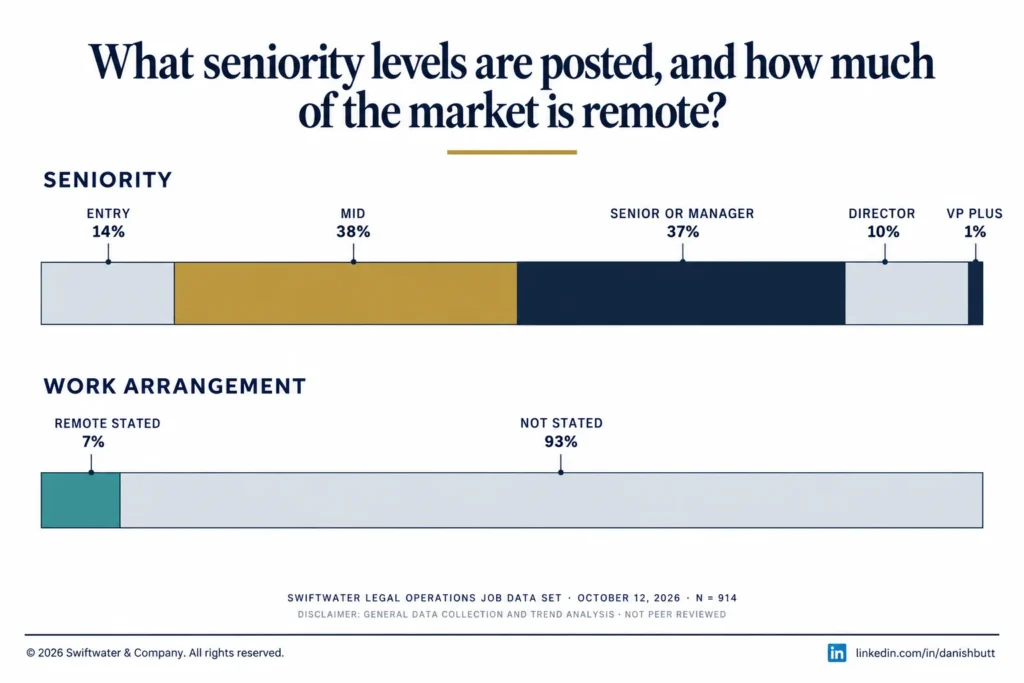
Mid-level and senior or manager-level roles dominate, with 344 and 342 postings, together 75% of the data set. Entry-level roles account for 130 postings (14.2%), Director roles 88 (9.6%), and VP or above 10 (1.1%). Levels are as assigned in the data set, so a posting with an unusual title may sit one level off.
Building the legal operations function from scratch?
Assessment, roadmap, and delivery for the operational side of the department: spend, technology, process, vendors, and the data that proves what legal delivers. Advice from operators who ran the function.
See Legal Ops ConsultingThe ten most common titles, as written in the postings, show how much of the market sits in billing and contracts work:
| Title as posted | Postings | Typical discipline |
|---|---|---|
| Billing Specialist | 27 | E-billing and bill review |
| Billing Coordinator | 23 | E-billing and bill review |
| Legal Operations Manager | 23 | Generalist |
| Legal Billing Specialist | 19 | E-billing and bill review |
| Legal Operations Specialist | 17 | Generalist |
| Contracts Manager | 15 | CLM and contracts |
| Legal Operations Analyst | 13 | Generalist |
| Legal Operations Coordinator | 12 | Generalist |
| Legal Engineer | 11 | Legal engineering and AI |
| Contract Manager | 10 | CLM and contracts |
Titles vary widely: the 914 postings use 629 distinct titles, and only these ten appear ten times or more. The legal operations roles guide explains what each seat does, from analyst to Chief Legal Operations Officer.
How much of the market is remote?
Only 62 of 914 postings (6.8%) state remote work in the location field. The remaining 852 name an office location or say nothing about the arrangement, and the data set cannot tell hybrid from onsite for most of them. Remote work in legal operations is real, but in this data set employers rarely advertise it up front. Without agency postings the share is about the same: 58 of 864 (6.7%).
For candidates, the practical reading is that remote and hybrid terms are usually settled in the interview. For employers, stating the arrangement in the posting is a simple way to stand out among the 852 that do not.
What salary ranges are posted?
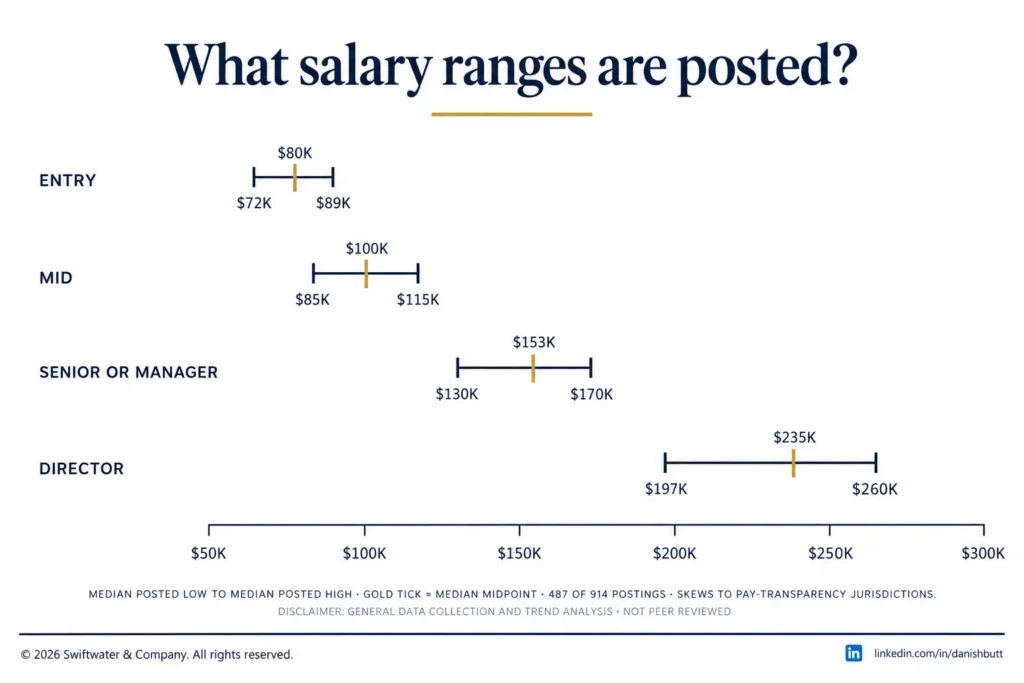
Of the 914 postings, 577 (63.1%) state some pay figure, and 487 (53.3%) give an annual US dollar range we could use. The typical posted range runs from about $72,000 to $89,000 at entry level up to about $197,000 to $260,000 for Director roles. Senior and manager-level postings typically range from about $130,000 to $170,000, with a median midpoint of $152,500.
| Level | Typical posted range (median low to median high) | Postings with an annual USD range |
|---|---|---|
| Entry | $72,100 to $88,500 | 58 of 130 |
| Mid | $85,000 to $115,000 | 183 of 344 |
| Senior or manager | $129,650 to $170,000 | 192 of 342 |
| Director | $196,500 to $260,000 | 47 of 88 |
| VP and above | Ranges from $120,000 to $361,000 (too few for a median) | 7 of 10 |
The median midpoints are $80,000 (entry), $100,000 (mid), $152,500 (senior or manager), and $235,000 (Director). Postings titled legal operations manager, 30 of which give a range, typically post $120,000 to $151,000, as covered in our legal operations manager job description.
Agency postings barely move these figures. Without them, 455 of 864 postings give an annual range, the entry, mid, and senior or manager midpoints are unchanged, and the Director midpoint is $230,000 instead of $235,000.
Some pay figures are left out of the ranges and counted separately. Thirty-one postings give an hourly rate, typically $40 to $50 an hour. Forty-two describe total compensation or on-target earnings, 16 give several ranges, and one is in another currency. Posted ranges also lean toward jurisdictions with pay transparency laws, so they describe those markets better than the rest.
Where are the roles?
New York leads with 208 postings, followed by the San Francisco Bay Area with 143, Chicago with 99, and Washington, DC with 86. Los Angeles, Boston, Houston, Seattle, Philadelphia, and Dallas complete the top ten. A posting that lists several locations counts in each metro it names, so these counts add up to more than the number of postings.
| Metro | Postings naming it | Share of 914 |
|---|---|---|
| New York | 208 | 22.8% |
| San Francisco Bay Area | 143 | 15.6% |
| Chicago | 99 | 10.8% |
| Washington, DC | 86 | 9.4% |
| Los Angeles | 76 | 8.3% |
| Boston | 57 | 6.2% |
| Houston | 52 | 5.7% |
| Seattle | 33 | 3.6% |
| Philadelphia | 33 | 3.6% |
| Dallas | 29 | 3.2% |
The concentration follows the largest corporate and legal markets. Several of the top metros are also in states with pay transparency laws, which is one reason posted ranges are more common there.
What do the postings say about the legal operations function?
The postings describe a function that is splitting into specialties. Generalist roles are still the largest group, but billing, contracts, and legal engineering together outnumber them more than two to one. The Director seat appears in 88 postings, and legal engineering and AI transformation roles account for 123.
- The generalist seat is broad. Of the 51 postings titled legal operations manager, 46 are generalist roles. A department hiring its first legal operations manager is usually asking one person to cover spend, technology, and process.
- Specialist work is where the volume is. Billing specialists, billing coordinators, and contracts managers are among the most common titles. Much of the market is hiring for one program, run well.
- Legal engineering is a real category. With 123 postings, legal engineering and AI transformation is larger than legal procurement and legal technology systems combined. The legal operations certifications guide covers the credentials appearing around it.
- Paralegal hybrids are rare in titles. Only 8 postings (0.9%) put “paralegal” in the title. Hybrid duties may be more common inside job descriptions, which this edition does not include.
Departments deciding how large a legal operations team should be can read these postings alongside the survey medians below. Where hiring takes too long, Swiftwater’s managed legal operations team covers the seat in the meantime.
How does this compare with the surveys?
The postings fit what the major surveys say. The 2026 ACC Law Department Management Benchmarking Report puts legal operations at 5% of legal headcount, about one legal operations professional for every eight lawyers, with a median of zero below $5 billion in company revenue. That is consistent with a market where many postings are for a department’s first or second legal operations hire.
Need the function run, not just advised on?
Swiftwater embeds senior practitioners directly into legal operations, handling bill review, matter management, and program delivery on your behalf.
See Managed ServicesOn pay, Brightflag’s 2026 Legal Operations Compensation Report, published March 19, 2026, found that legal operations compensation is not correlated with job title: total cash for respondents titled legal operations manager ranged from $44,000 to $347,000. For heads of legal operations it found median total compensation rising with department size, from $139,000 under ten people to $264,000 over one hundred. Posted ranges and survey figures measure different things. A posting gives the base range an employer advertises, and a survey reports what respondents earn, including bonus.
On team growth, the Blickstein Group’s 18th Annual Law Department Operations Survey found 30.8% of legal operations teams expected to grow over the next year, 58.5% to stay the same, and 10.8% to shrink. The surveys have their own limits. They tend to under-count companies creating the Director seat for the first time and the very largest departments, and the posting data covers some of that gap.
Bottom Line
The October 2026 edition of Swiftwater’s legal operations job data set shows a market of 914 postings led by generalist, e-billing, and contracts roles, with legal engineering growing into a category of its own. Most postings are mid-level or senior, only 6.8% state remote work, and just over half give an annual pay range, typically about $130,000 to $170,000 at the senior or manager level.
The counts describe postings at one point in time, and the next edition will show which way they move. Use the report as a directional view of what employers ask for, and confirm any single figure against your own market before acting on it.
Hiring for a legal operations seat takes months. Swiftwater’s managed legal operations team covers the work while you hire, and our consultants help scope the role first. If you need more information on this data or want advice, contact us; we will be happy to discuss.
Frequently Asked Questions
What is the Swiftwater legal operations job market report?
Swiftwater’s legal operations job market report counts and describes the legal operations roles employers post publicly. The October 2026 edition covers 914 postings from 648 employers: disciplines, seniority, remote share, posted salary ranges by level, and where the roles are.
How many legal operations jobs are open?
The October 12, 2026 edition of Swiftwater’s legal operations job data set holds 914 postings from 648 employers. Of those, 711 were posted or confirmed in the previous 30 days. The count describes this data set only, which is curated weekly from public postings.
What is the salary range for legal operations jobs?
Typical posted ranges run from about $72,100 to $88,500 at entry level, $85,000 to $115,000 at mid level, $129,650 to $170,000 at senior or manager level, and $196,500 to $260,000 for Director roles. They come from the 487 of 914 postings that give an annual US dollar range.
How much does a legal operations manager make?
Senior and manager-level postings typically range from $129,650 to $170,000. Postings titled legal operations manager, 30 of which give a range, typically post $120,000 to $151,000. Brightflag’s 2026 survey found total cash for that title ranging from $44,000 to $347,000.
Are legal operations jobs remote?
Only 62 of 914 postings (6.8%) state remote work in the location. Most name an office location or do not state the arrangement, so remote and hybrid terms are usually settled during hiring.
Where are most legal operations jobs located?
New York leads with 208 postings, followed by the San Francisco Bay Area with 143, Chicago with 99, Washington, DC with 86, and Los Angeles with 76. Postings that list several locations count in each metro they name.
Which legal operations roles are most in demand?
Generalist legal operations (209 postings), e-billing and bill review (207), and CLM and contracts operations (191) lead, followed by legal engineering and AI transformation (123). The most common titles are billing specialist, billing coordinator, and legal operations manager.
How often is the report updated?
The report is updated each quarter at the same address. October 2026 is the first edition, so it shows no trends yet. From the second edition on, the counts can be compared on the same basis.
Method and caveats
Source. Swiftwater’s legal operations job data set, October 12, 2026 edition: 915 rows from public job postings curated weekly from employer career sites and legal operations job sources, with one duplicate removed (same employer, title, and location), leaving 914. Each posting carries a title, employer, discipline (nine categories), level (five), location, posted pay where present, and the date posted or last confirmed. The data set includes no industry field and no job description text, so the report has no industry cut and no analysis of duties.
People and tools. Imran Jaswal, President & Co-Founder, oversaw the data gathering and analysis. The data was gathered and analyzed with AI under supervision, in conjunction with Swiftwater AI Labs, as a quick overview analysis. Data quality and individual details received general verification only.
How figures are computed. Every figure states the count it comes from. Postings missing an attribute are left out of that figure and never counted as zero. Pay is normalized before any range or median: annual US dollar ranges are used for the level table; hourly rates are shown separately; other currencies, total compensation figures, multiple ranges, and figures without a unit are excluded from the US dollar figures. Medians are of the posted lows, the posted highs, and the range midpoints, and are shown only where the count supports them. Staffing and recruiting firm postings are identified by company name and shown with and without. Metros count every location a posting names. The edition snapshot and the counts behind every figure are saved so the next edition can be compared on the same basis.
Limits. Postings are not a statistical sample. Posted pay ranges lean toward jurisdictions with pay transparency laws. Postings can be stale, duplicated across sources, or placed by agencies, and the data set flags those where it can. The figures count postings. They do not count hires. Survey benchmarks are cited for comparison and carry their own caveats.
This report is a research project for education and information purposes only, developed in conjunction with Swiftwater AI Labs. It is an informational and directional study, done for internal use and shared for the good of the industry, and it does not constitute legal, employment, or compensation advice. If you see any discrepancies, please disregard them; individual details were only generally verified. Brightflag figures are cited from its 2026 Legal Operations Compensation Report with attribution. No employer is named, and no posting is endorsed. If you believe any material on this page should be corrected or removed, contact us through the contact form.